|
Browse - Trace Data |

|

|
|
|
Browse - Trace Data |
|
|
Browse - Trace Data
|
Browse - Trace Data |
|
|
|
|
Browse - Trace Data |
|
|
The Trace Data area offers access to the stored trace data in a pre-defined way, thus you don't have to worry about relationships (server, project, trace session, ...) in the FB TraceManager 2 database.
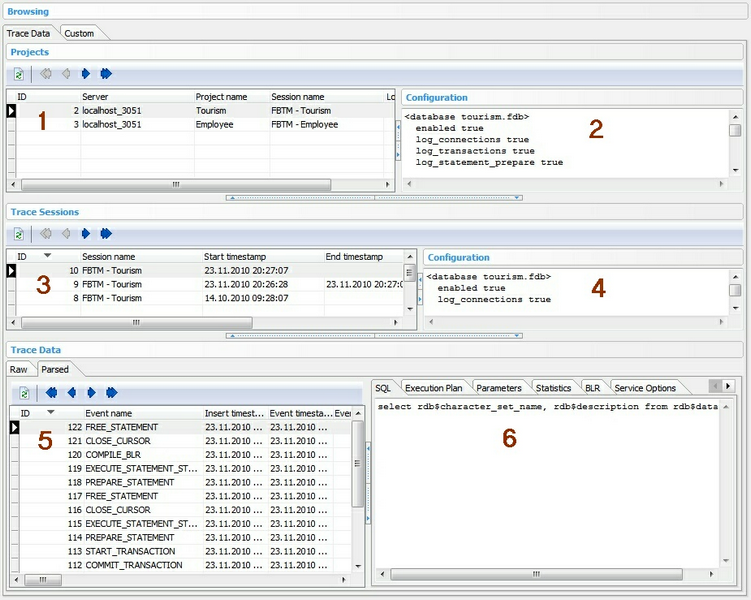
The screen is divided again into different sections:
| • | Section 1: List of projects |
| • | Section 2: Trace configuration for the selected project |
| • | Section 3: List of stored trace sessions |
| • | Section 4: Project trace configuration at trace session start |
| • | Section 5: Stored raw/parsed trace data for the selected trace session in section 3 |
| • | Section 6: Memo-like data (e.g. SQL statement, execution plan, parameters, statistics, BLR, Service Options, Service Query Lines) of the selected trace data record in section 5 |
The different splitter hot-spots allow you to expand/collapse the different sections as you like.
By selecting a project in section 3 of the Main Screen and clicking the Browse Trace Data button, you now can navigate to the Browse - Trace Data area and pre-selecting the project in section 1 very easily.
What's next: Use Custom queries to access stored trace data in an query-by-example environment.
See also