|
Quick Start Guide - Main Screen |

|

|
|
|
Quick Start Guide - Main Screen |
|
|
Quick Start Guide - Main Screen
|
Quick Start Guide - Main Screen |
|
|
|
|
Quick Start Guide - Main Screen |
|
|
The following figure shows the main screen of FB TraceManager 2 divided into different sections, which are described below.
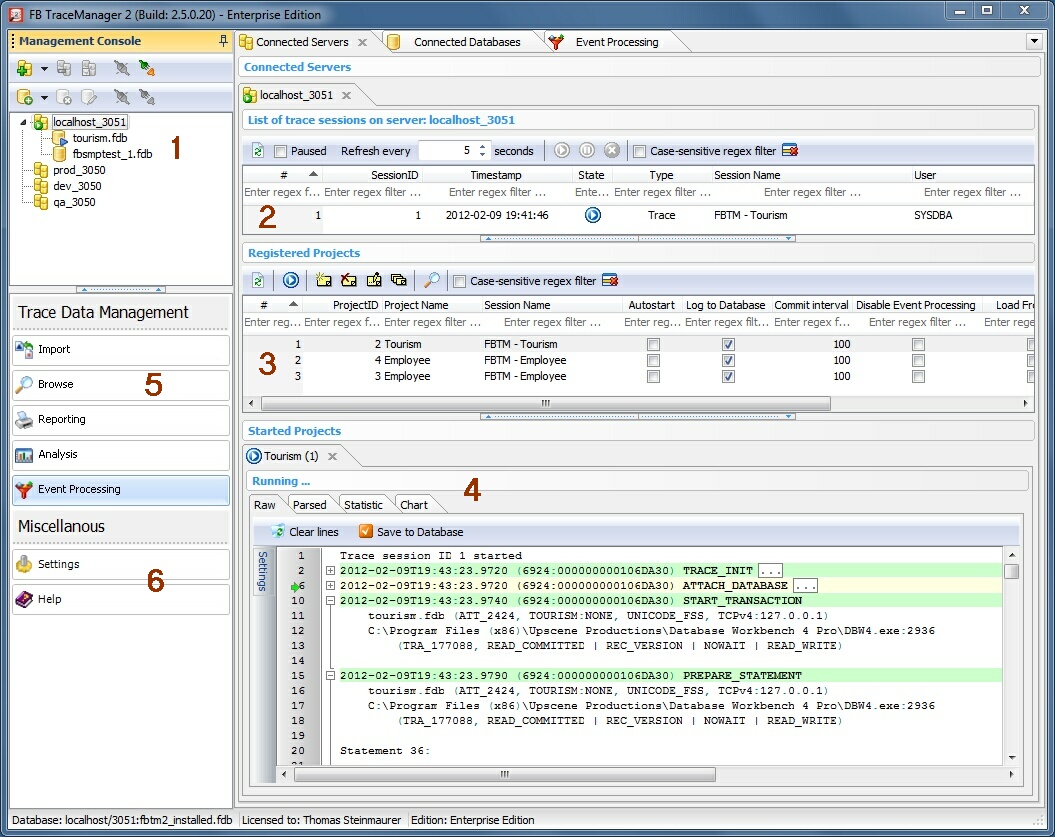
Section 1 - List of registered Servers/Databases
In this section you see a list of registered servers/database and if you are connected to a particular server/database. The toolbar allows the following user actions:
| 1. | Register a server/database |
| 2. | Duplicate a server/database entry |
| 3. | Unregister a server/database |
| 4. | Modify an existing server/database registration |
| 5. | Connect to the selected server/database |
| 6. | Disconnect from the selected server/database |
You can also connect to a server with a double-click on a server node.
Hint: Working with databases, thus the per-database monitoring facilities, aren't available in the Lite Edition.
Section 2 - List of currently started trace sessions
In this section you see a list of started trace sessions for the connected server and their states. The list of trace sessions is re-fetched from the server every <N> seconds automatically, if the Paused option is not checked. You can also manually refresh the list of trace sessions by clicking the Refresh Sessions button. In the toolbar you can also:
| 1. | Resume |
| 2. | Pause |
| 3. | Stop |
selected trace sessions. You can select multiple trace sessions with CTRL and/or SHIFT.
Section 3 - List of registered projects
In this section you see a list of registered projects for the connected server. Basically, a project is the definition of a trace configuration and its optional trace session name. The toolbar provides the following functionality:
| 1. | Refresh the list of registered projects |
| 2. | Start a trace session from the selected project |
| 3. | Create a new project |
| 4. | Delete the selected project |
| 5. | Edit the selected project |
| 6. | Duplicate a project, which means, creating a new project based on (modified) data of the selected project |
| 7. | Navigate to the Browse module for the selected project |
You can select multiple projects with CTRL and/or SHIFT.
Section 4 - List of started projects and trace data visualization
In this section you see a list of started projects for the connected server. To start a trace session, select a project in Section 3 and click the Run Project button. Each started trace sessions is shown in its own tab in Section 4. The output of received trace data is shown in different ways, depending on the product edition you are using. Check out the Product Editions section.
| • | Raw |
| • | Parsed |
| • | Statistic |
| • | Chart |
For more information on the different trace data visualization capabilities of FB TraceManager 2, please check out the QSG section Trace Data Visualization.
In the Lite Edition, only the Raw mode is available.
Section 5 - Trace Data Management
Section 5 offers additional functionality in respect to trace data management, including:
| 1. | Import: Importing trace output data into the FB TraceManager 2 database. See Import. |
| 2. | Browse: Browse stored trace data. See Browse. |
| 3. | Reports: Design and run reports on stored trace data. See Reports. |
| 4. | Analysis: Execute multi-dimensional ad-hoc queries on stored trace data. See Analysis. |
| 5. | Event Processing: Execute actions upon user-defined conditions on parsed trace data. See Event Processing. |
Section 6 - Miscellaneous
Here you can find general things like program settings and access to this documentation.
What's next: In the next QSG section Register Server, you will see how to register a Firebird server.
See also