|
Analysis - Basics |

|

|
|
|
Analysis - Basics |
|
|
Analysis - Basics
|
Analysis - Basics |
|
|
|
|
Analysis - Basics |
|
|
Like reports, analysis objects can be managed in a freely definable hierarchical tree structure including two type of nodes:
| 1. | Folder |
| 2. | Analysis |
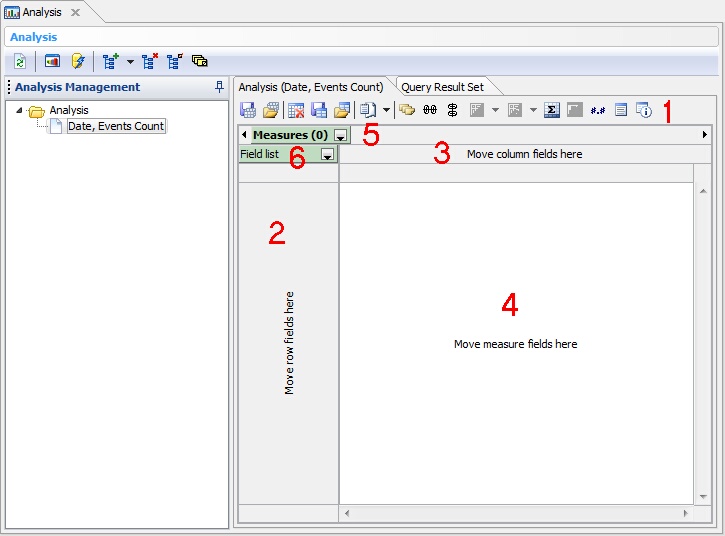
When you open the Analysis module by clicking the Analysis menu item in section 5 of the Main Screen, you end up with the following screen and a pre-installed one analysis folder structure.
The analysis folder structure can be managed by functions via a toolbar similar as in the Reports module.
| 1. | Refresh the tree node structure |
| 2. | Execute the analysis SQL query and open the analysis cube |
| 3. | Execute SQL query stored along the selected analysis node. The result set will be shown in the Query Result Set tab |
| 4. | Add a new analysis/folder node |
| 5. | Delete the selected analysis/folder node |
| 6. | Edit the selected analysis/folder node (F2) |
| 7. | Duplicate the selected analysis/folder node |
You can also drag&drop both type of nodes including their child nodes around.
The Analysis tab area is divided into the following sections:
| 1. | Analysis toolbar |
| 2. | Row fields area |
| 3. | Column fields area |
| 4. | Measure fields area |
| 5. | Measures |
| 6. | Field list |
These sections are discussed below.
Section 1 - Toolbar
The toolbar allows you to issue the following commands:
| 1. | Save current cube file |
| 2. | Load cube file |
| 3. | Clear grid, clearing all row, column and measure fields |
| 4. | Save current schema |
| 5. | Load schema |
| 6. | Export grid content into various formats |
| 7. | Show hints |
| 8. | Hide row zeros. This suppresses empty rows in the data grid |
| 9. | Hide column zeros. This suppresses empty columns in the data grid |
| 10. | Row sort type |
| 11. | Column sort type |
| 12. | Edit Measures. This allows to define measure, which are aggregates (count, sum, min, max, avg, ...) on field names |
| 13. | Data marker |
| 14. | Display Format |
| 15. | Field list |
| 16. | Statistics |
Section 2 - Row Fields Area
Row fields can be dropped onto this area. To drop fields you can either use the drop-down box of section 6 or the Field list toolbar button.
Section 3 - Column Fields Area
Column fields can be dropped onto this area. To drop fields you can either use the drop-down box of section 6 or the Field list toolbar button.
Section 4 - Measure Fields Area
Measure (aggregated) fields can be dropped onto this area. To drop fields you can either use the drop-down box of section 5 or the Field list toolbar button.
Section 5 - Measures
Here you can access all defined measures.
Section 6 - Field list
Here you can access all available fields of the underlaying dataset.
See also
Analysis Walk Through Analysis Example