Need to create custom reports?
Besides simple query result printing, Database Workbench includes a powerful Report Editor for creating reports for your data.
The so-called banded report editor allows you to create reports based on record data. Create summaries, groupings and additional child bands. You can display items and data on theese bands: text, images, cross-tabs, charts and bar codes: it's all supported.
- Create custom printable reports
- Save reports in the database Workspace or in files
- Use sub-reports, detail-bands for complex reporting
- Powerful cross-tab reporting for regular queries
Creating Reports
Reports can be stored in the Workspace project, which is available for each database. The Pro Edition supports saving reports to files, so they can be re-used on other databases.
First step is to create a source for the data using the Visual Query Builder. Next, the query is used as the starting point for data retrieval. You can use all sorts of data and items on the report, for example:
- Plain text and rich text
- Images
- Bar-codes
- Shapes, like lines, rectangles and so on
- Cross-tabs
- System variables, like page number
Result set columns can be used as (text) items on the report or combined into a single item using the Expression Editor. Additional formatting and highlighting options are available for each data item.
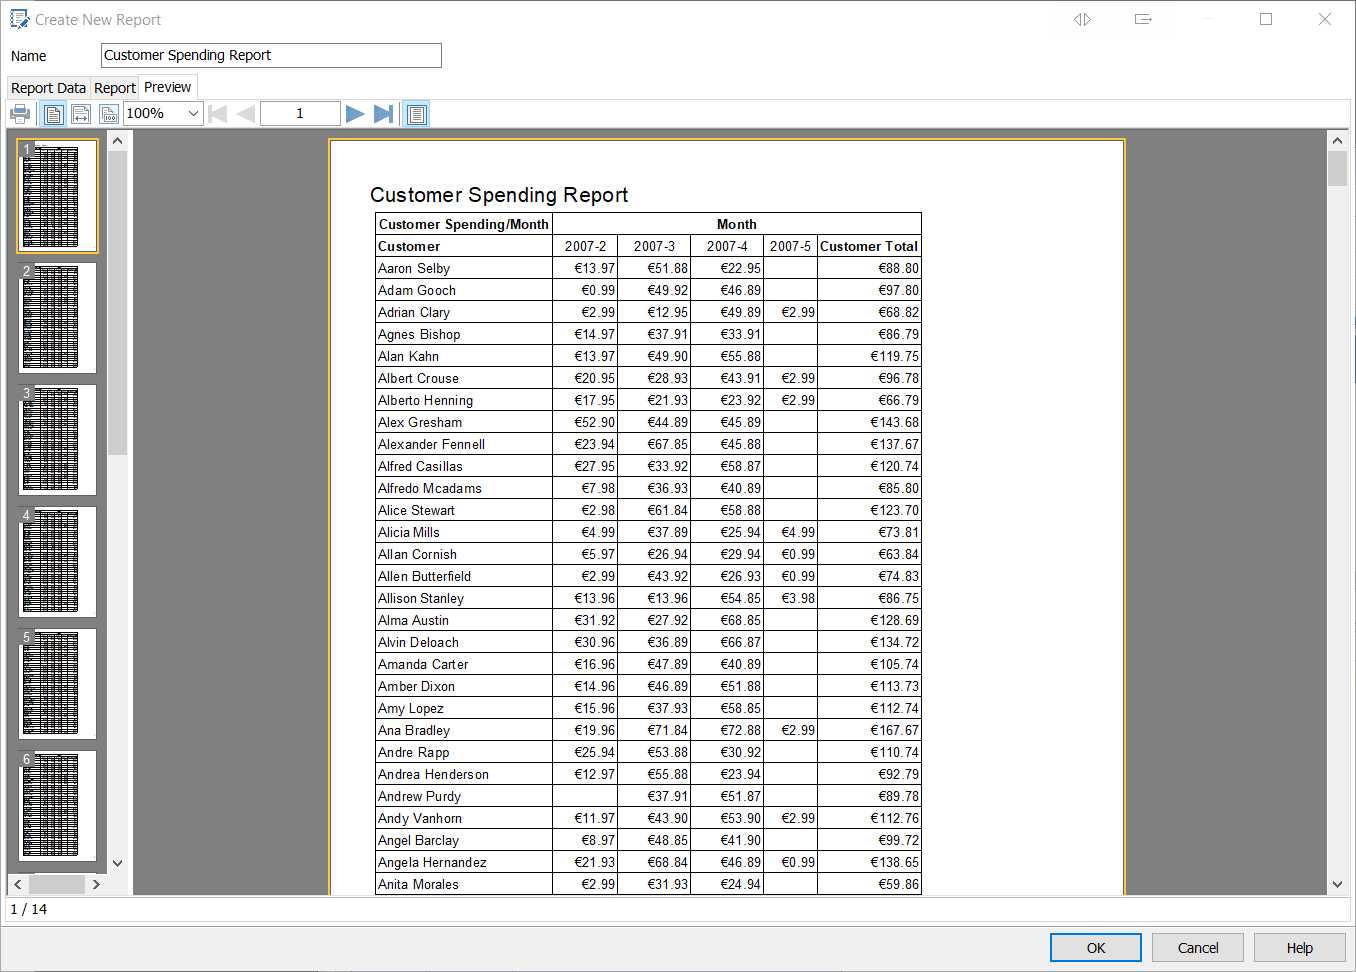
Print Preview
A Print Preview is available at another tab, allowed you to quickly check what you've done so far.
When previewing, a report is fully processed, including all formatting, colouring and so on.
The context menu on a report in the Workspace has a direct "print" option available, which shows the print preview too.
Complex Reports
In addition to simple tabular reports, the Report Editor supports cross-tab reports too. You can see plain data in the screen shot, the report design and the resulting report in the print preview. A second cross-tab report example is also shown.
Additional grouping of data is possible too. The film-query now sorts data by "release year" and "film title". Next add a grouping header with a grouping condition for the release year is added, the report engine processes the data and groups it in the report, starting each new year on a new page.